₹134 Cr in Amazon revenue. Across 63 brands.
Real numbers from real client accounts. 27 case studies below — each one a brand we actively manage. Pick a category, see the work, decide if we're the right team for yours.
Portfolio aggregate · real numbers
5.35x
Blended ROAS
18.7%
Blended ACOS
1M+
Orders Shipped
2.29 Bn
Impressions
Amazon Revenue
₹134 Cr+
Ad-Attributed Sales
₹55 Cr+
Brands Managed
63
Case Studies
27
The work
Filter by what you need.
₹134.49 Cr in Amazon Revenue Across 63 Brands
ATIL managed Amazon advertising for 63 brands — generating ₹134.49 Cr in total Amazon revenue, 1M+ orders, at 18.7% blended ACOS and 5.35x ROAS. ₹55.19 Cr ad-attributed sales. 143,897 new-to-brand customers acquired.
Read the full portfolio breakdown →₹134.49 Cr
Total Amazon Revenue
₹55.19 Cr
Ad-Attributed Sales
₹10.32 Cr
Total Ad Spend Managed
Automaze: Conversion Rate 3.12% → 3.6% (+15.4%), Ad Sales ₹1.65 Cr → ₹1.91 Cr (+15.8%)
3.12% → 3.6%
Conversion Rate
₹1.65 → ₹1.91 Cr
Ad Sales
Casa Metallic: NTB% 22.8% → 56.9% (+149.6%), Conversion Rate 0.98% → 1.54% (+57.1%)
22.8% → 56.9%
New-to-Brand %
0.98% → 1.54%
Conversion Rate
D2C Multi-Category: 9.55× ROAS, ₹4.60 Cr Amazon Revenue
9.55×
Blended ROAS
₹4.60 Cr
Total Amazon Revenue
Fitinc Apparels: CTR 0.25% → 0.43% (+72%), Total Amazon Revenue ₹0.88 Cr → ₹1.14 Cr (+29.5%)
0.25% → 0.43%
CTR
₹0.88 → ₹1.14 Cr
Total Revenue (per window)
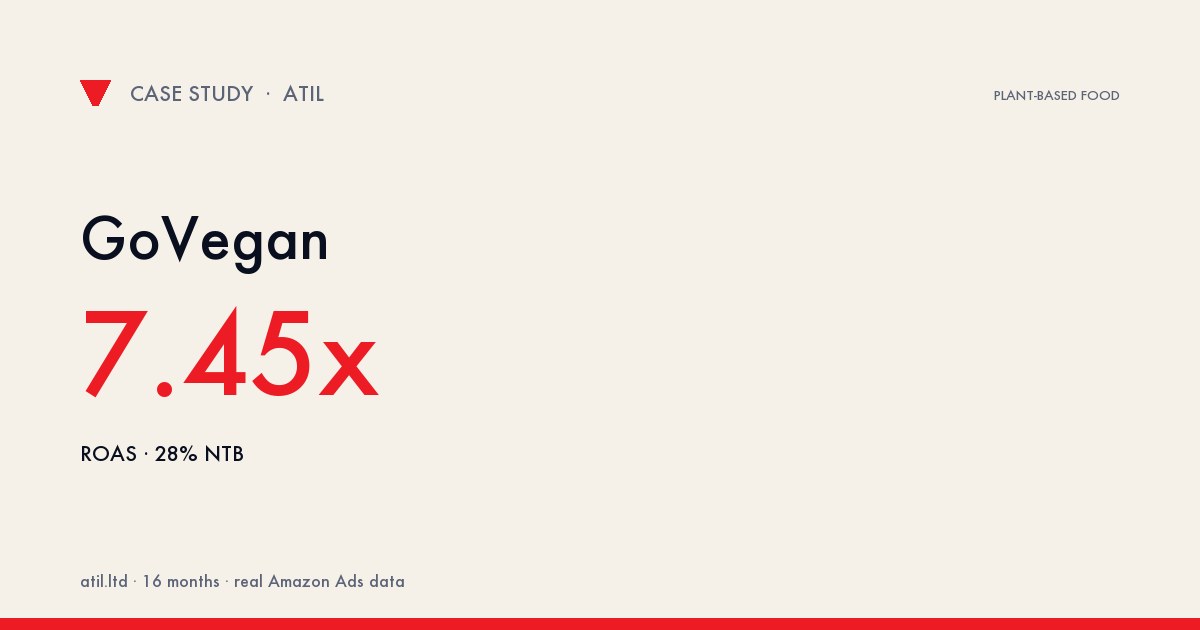
GoVegan: ROAS 7.34x → 8.78x (+19.6%), Total Amazon Sales ₹2.46 Cr → ₹6.7 Cr (+172.4%)
7.34x → 8.78x
ROAS
₹2.46 → ₹6.70 Cr
Total Amazon Revenue
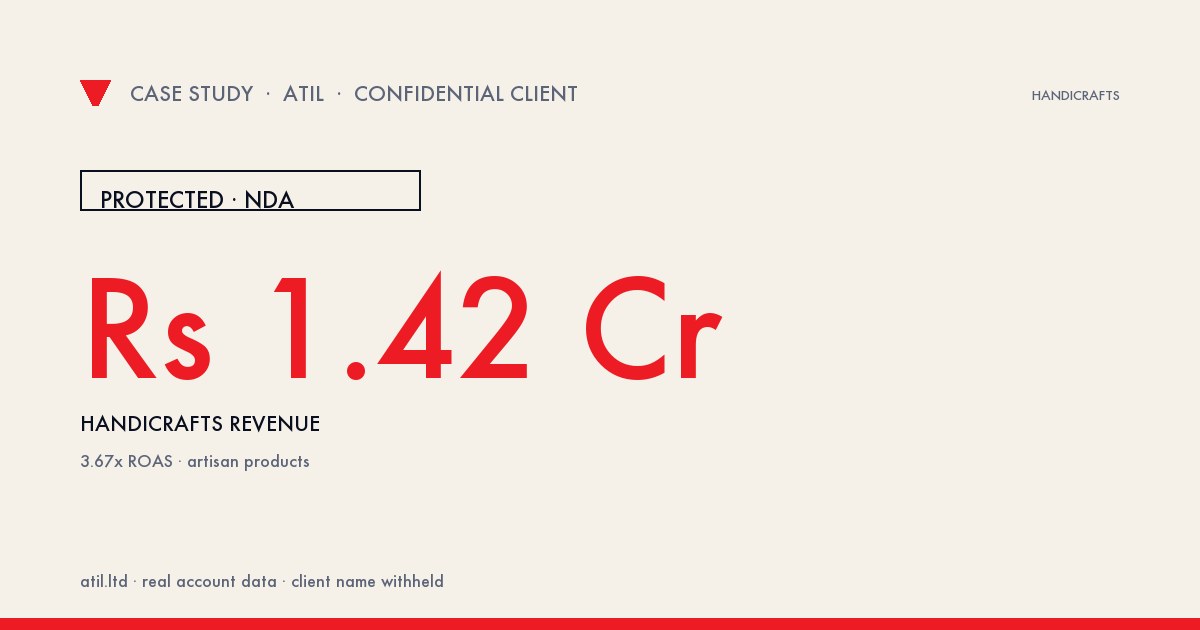
Handicrafts Brand: ₹1.42 Cr Revenue at 3.67× ROAS
3.67×
Blended ROAS
₹1.42 Cr
Total Amazon Revenue
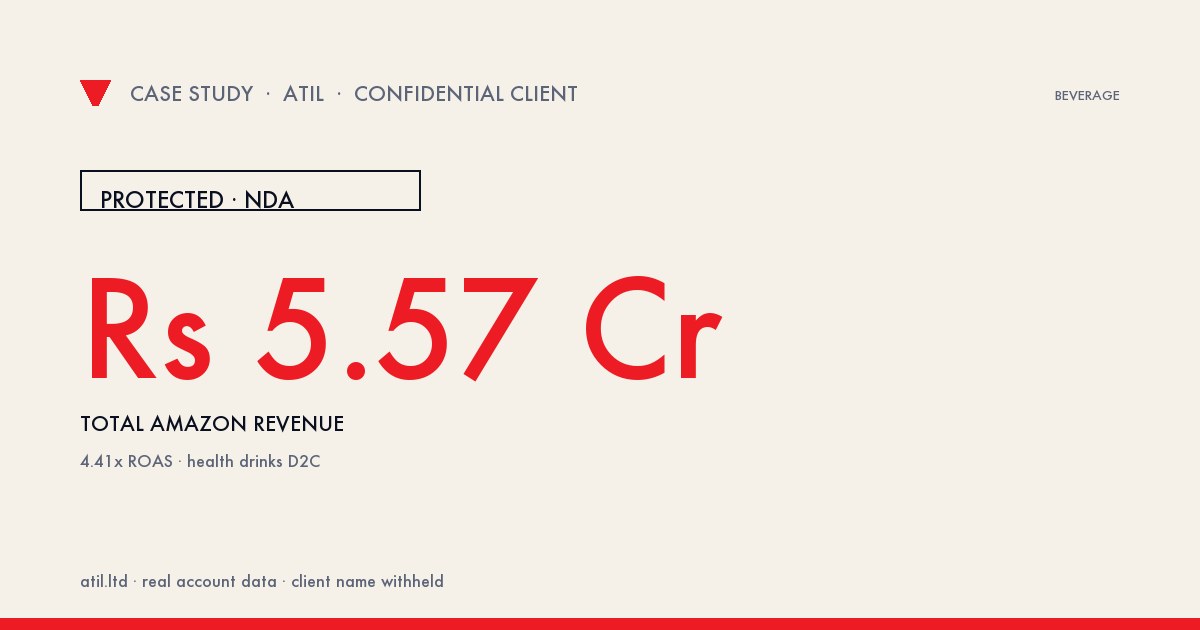
Health Drinks D2C: ₹5.57 Cr Amazon Revenue at 4.41× ROAS
₹5.57 Cr
Total Amazon Revenue
₹2.25 Cr
Ad-Attributed Sales
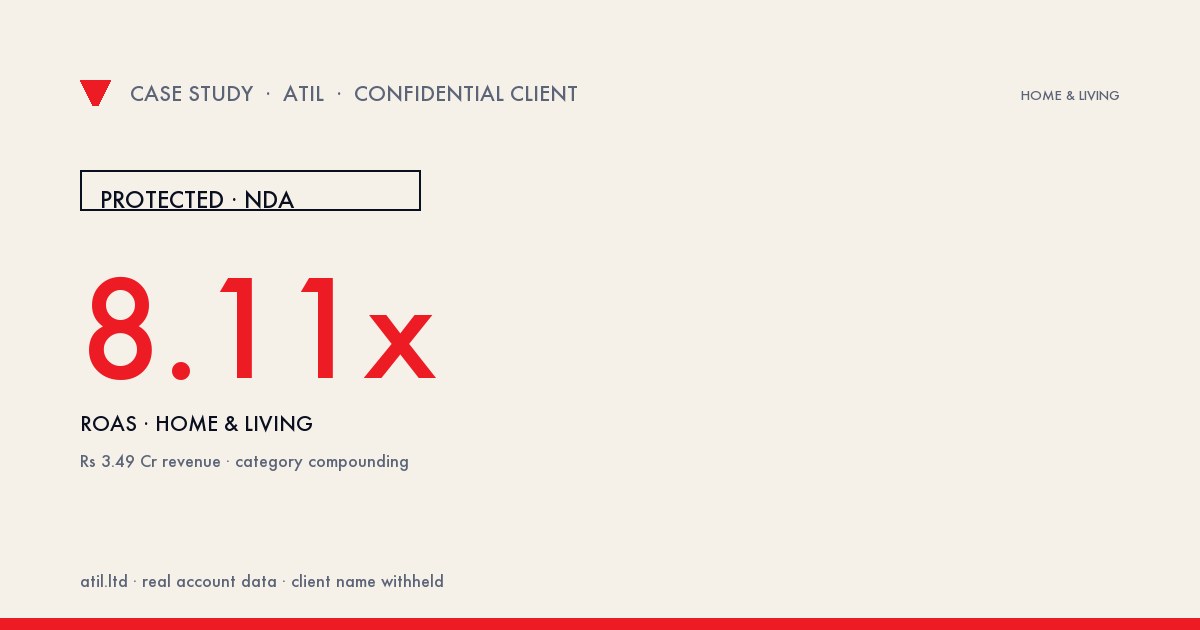
Home & Living Brand: 8.11× ROAS, ₹3.49 Cr Amazon Revenue
8.11×
Blended ROAS
₹3.49 Cr
Total Amazon Revenue
Hospitality Brand: 4.44× ROAS, ₹2.32 Cr Amazon Revenue
4.44×
Blended ROAS
₹2.32 Cr
Total Amazon Revenue
Industrial Hardware Brand: 4.68× ROAS at Tight ACOS
4.68×
Blended ROAS
₹2.05 Cr
Total Amazon Revenue
JADEMECH: 31.6% NTB Orders at 6.59x ROAS — ₹2.37 Cr Total Amazon Revenue
6.59x
ROAS
31.6%
New-to-Brand Orders
Lifestyle & Gifts Brand: 5.54× ROAS on Amazon
5.54×
Blended ROAS
₹1.25 Cr
Total Amazon Revenue
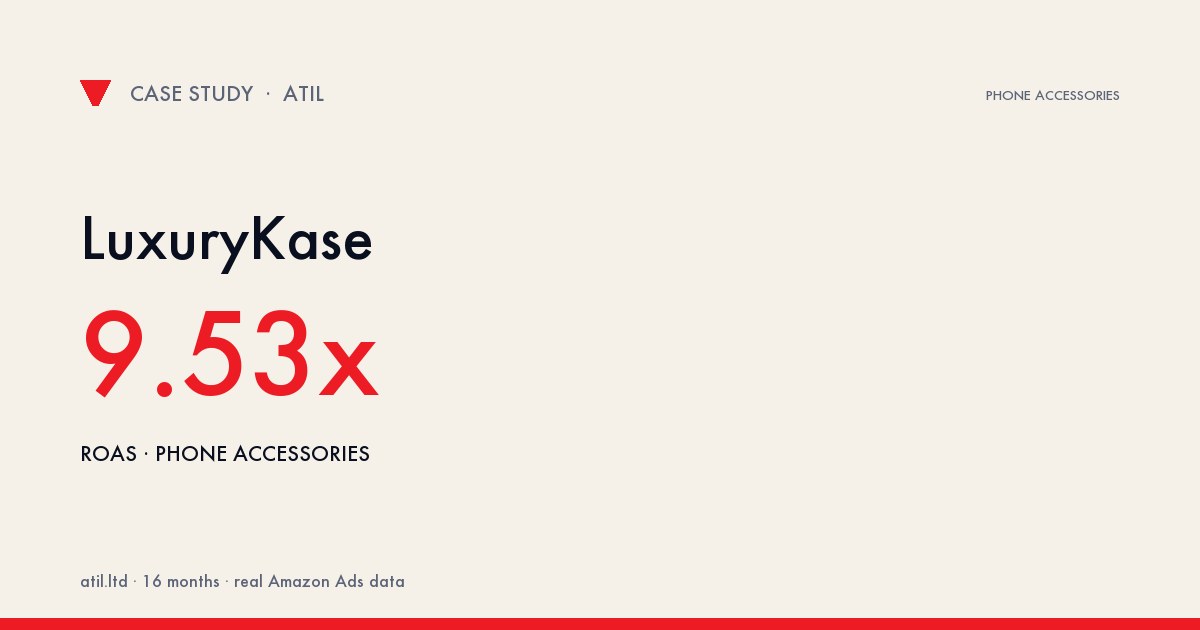
LuxuryKase: ACOS 16.8% → 10.5% (−37%), ROAS 5.94x → 9.53x (+60%)
16.8% → 10.5%
ACOS
5.94x → 9.53x
ROAS
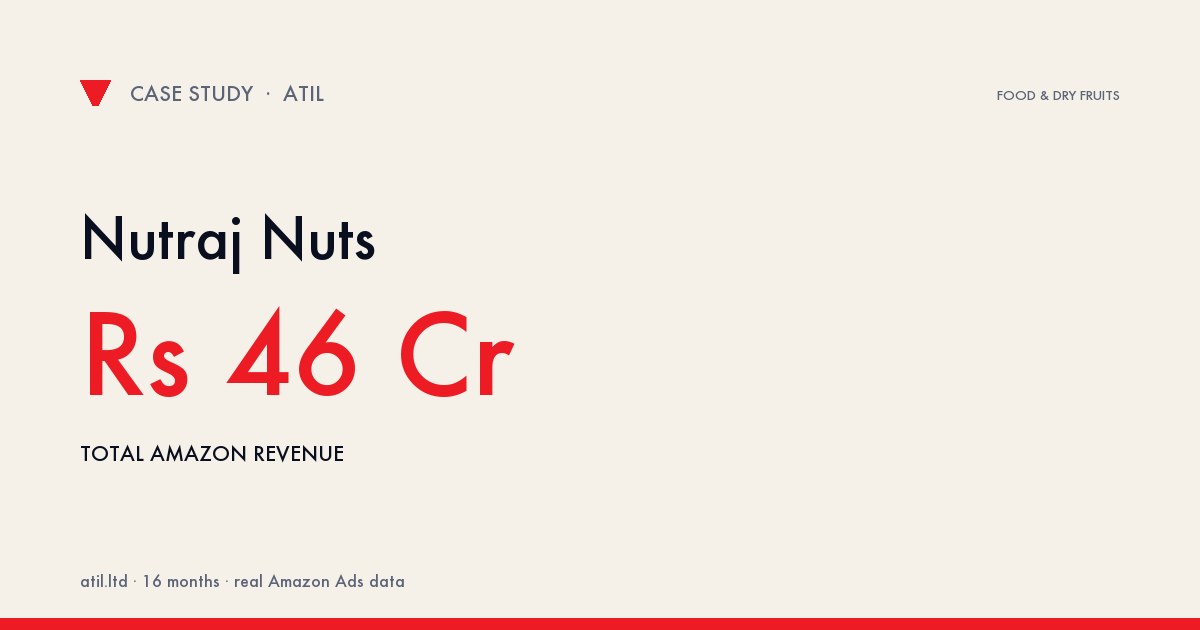
Nutraj: ROAS 6.0x → 6.89x (+14.8%), ACOS 16.7% → 14.5% (−13.2%), Ad Sales +8.7%
6.0x → 6.89x
ROAS
16.7% → 14.5%
ACOS
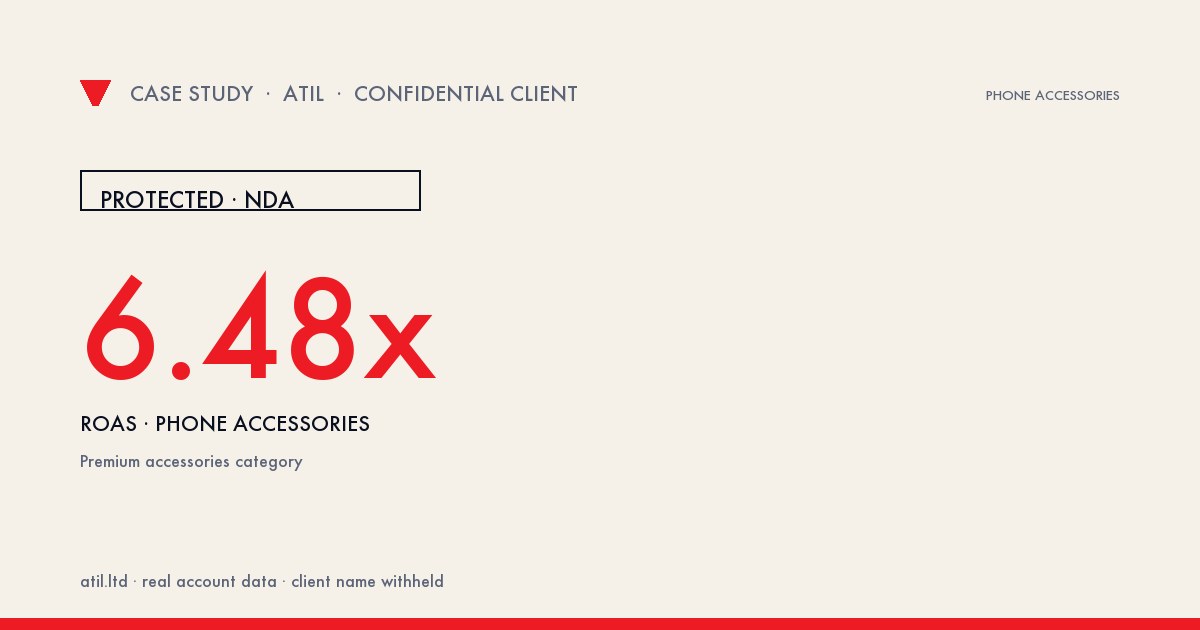
Phone Accessories Brand: 6.48× ROAS on Amazon
6.48×
Blended ROAS
₹1.80 Cr
Total Amazon Revenue
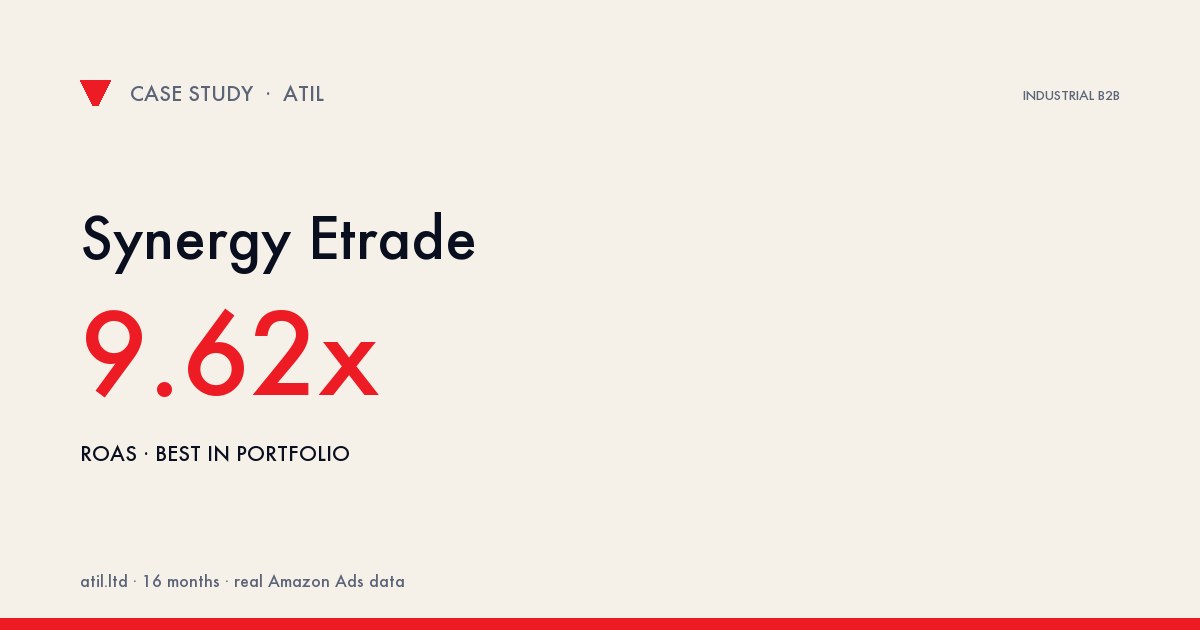
Synergy Etrade: 9.62x ROAS — Best in Our Portfolio — 10.4% ACOS, ₹3.09 Cr Ad Sales
9.62x
ROAS
₹3.09 Cr
Ad-Attributed Sales
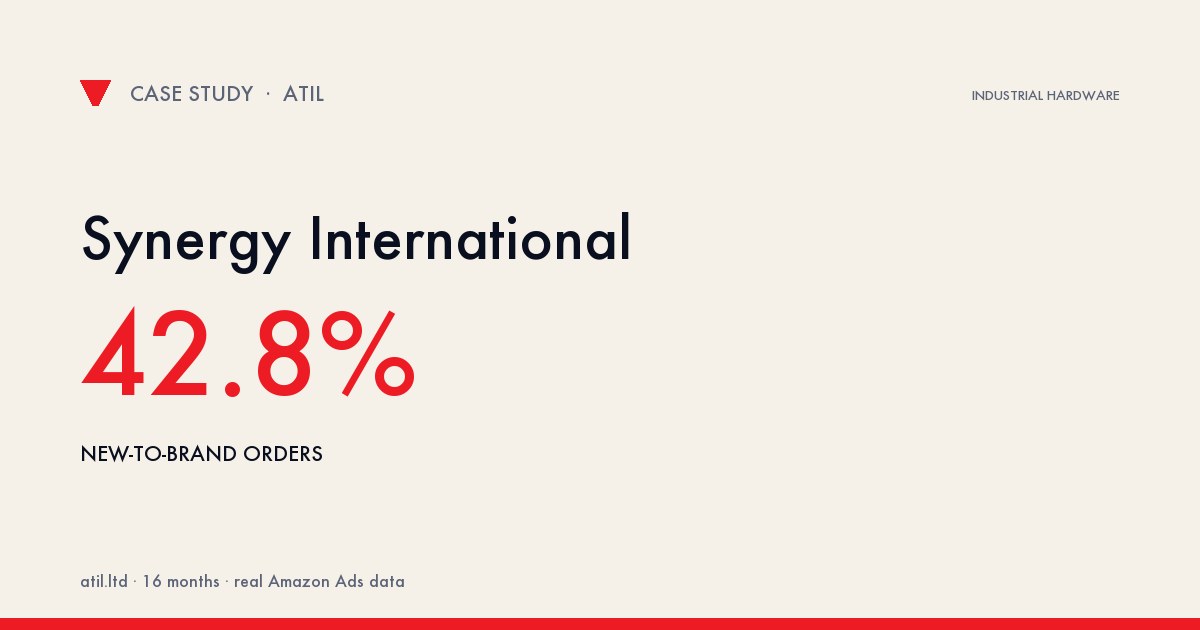
Synergy International: Conversion Rate 6.07% → 11.2% (+84.5%), Ad Sales ₹0.64 Cr → ₹1.65 Cr (+157.8%)
6.07% → 11.2%
Conversion Rate
5.98x → 9.18x
ROAS
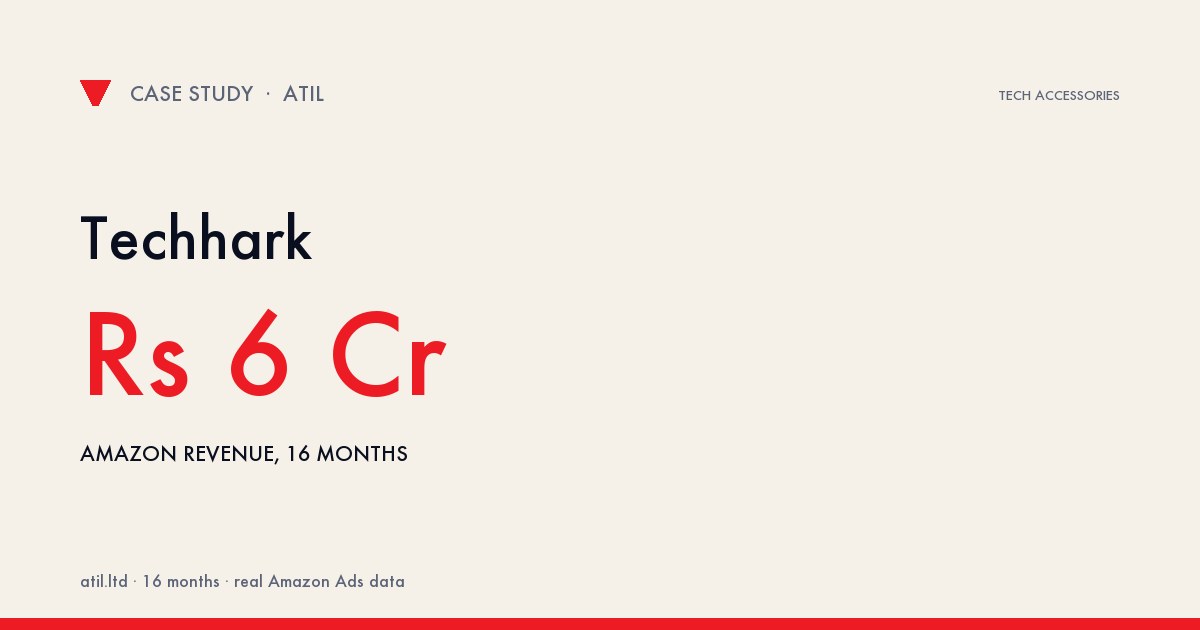
Techhark: Conversion Rate 11.38% → 14.26% (+25.3%), Orders 5,423 → 8,115 (+49.6%)
11.38% → 14.26%
Conversion Rate
5,423 → 8,115
Orders
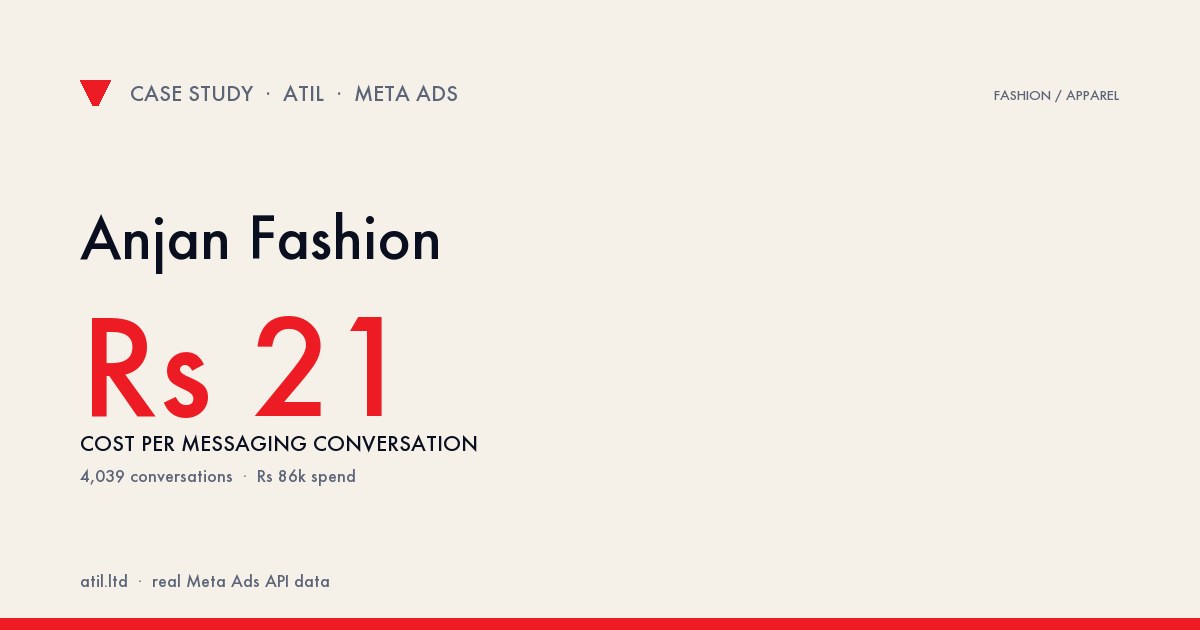
Anjan Fashion: ₹21 Cost per Messaging Conversation — 4,039 WhatsApp Chats from ₹86k Spend
₹38 → ₹15
Cost per Conversation
4,039
Conversations Delivered
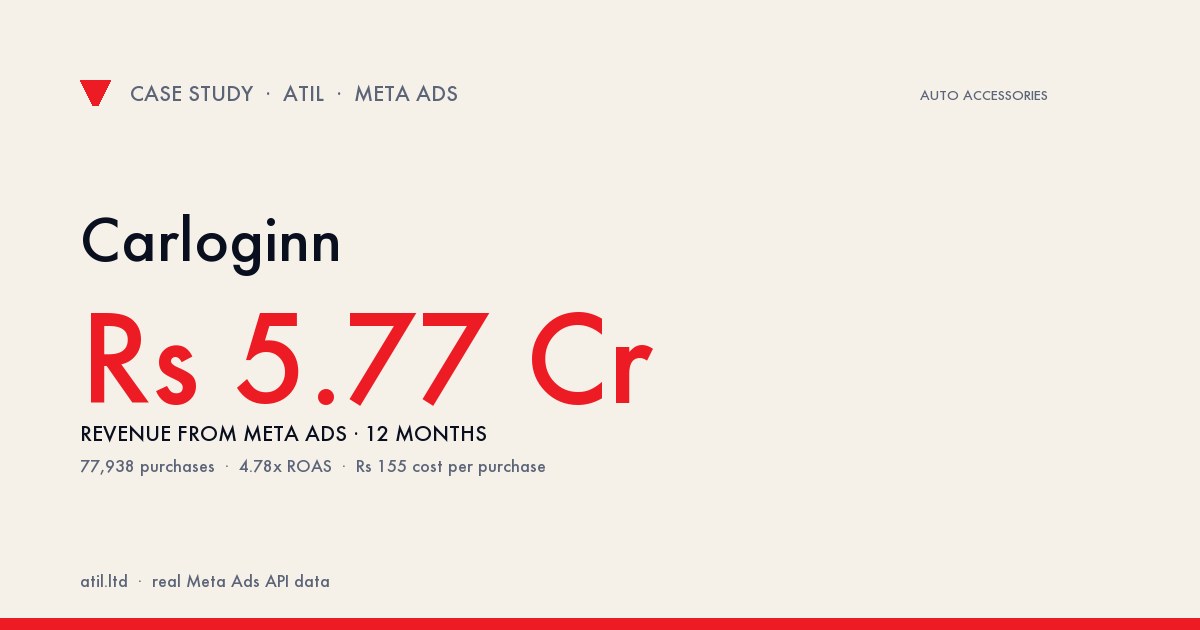
Carloginn: ROAS 4.12x → 5.37x (+30%), Cost per Purchase ₹187 → ₹142 (−24%) on Meta Ads
₹5.77 Cr
Total Meta Ads Revenue
₹1.21 Cr
Total Spend
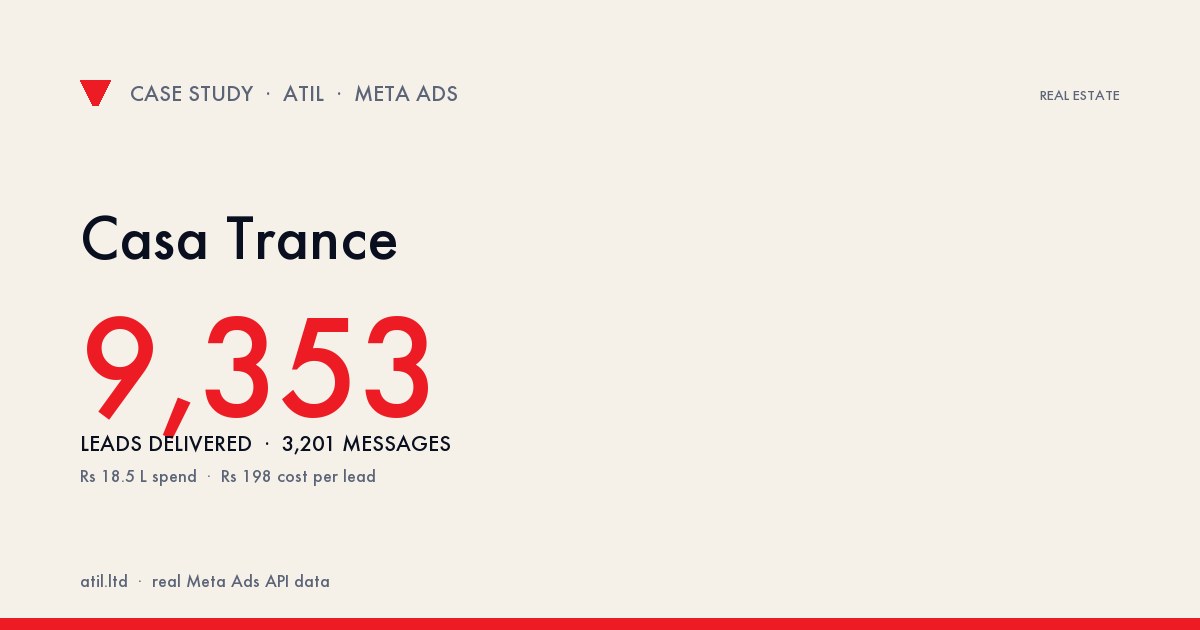
Casa Trance: 9,353 Leads + 3,201 WhatsApp Conversations at ₹198 CPL — Real Estate Meta Ads
9,353
Leads Delivered
3,201
Messaging Conversations
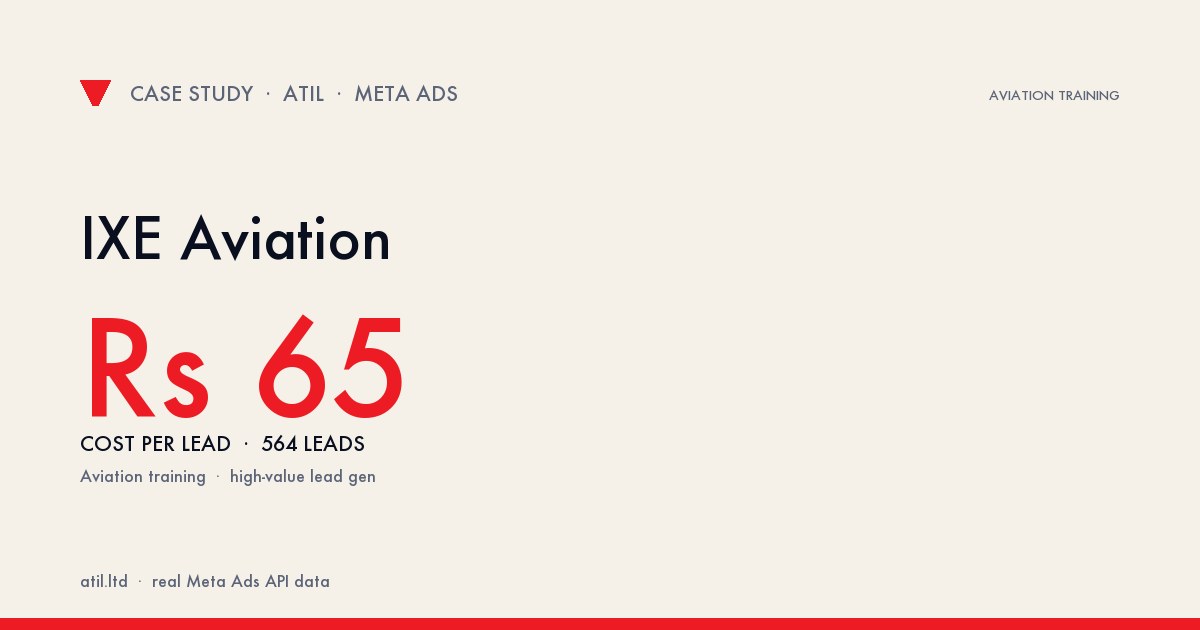
IXE Aviation: 564 Pilot-Training Leads at ₹65 CPL — High-Ticket B2C Lead Gen on Meta
564
Leads Delivered
₹65 blended
Cost per Lead
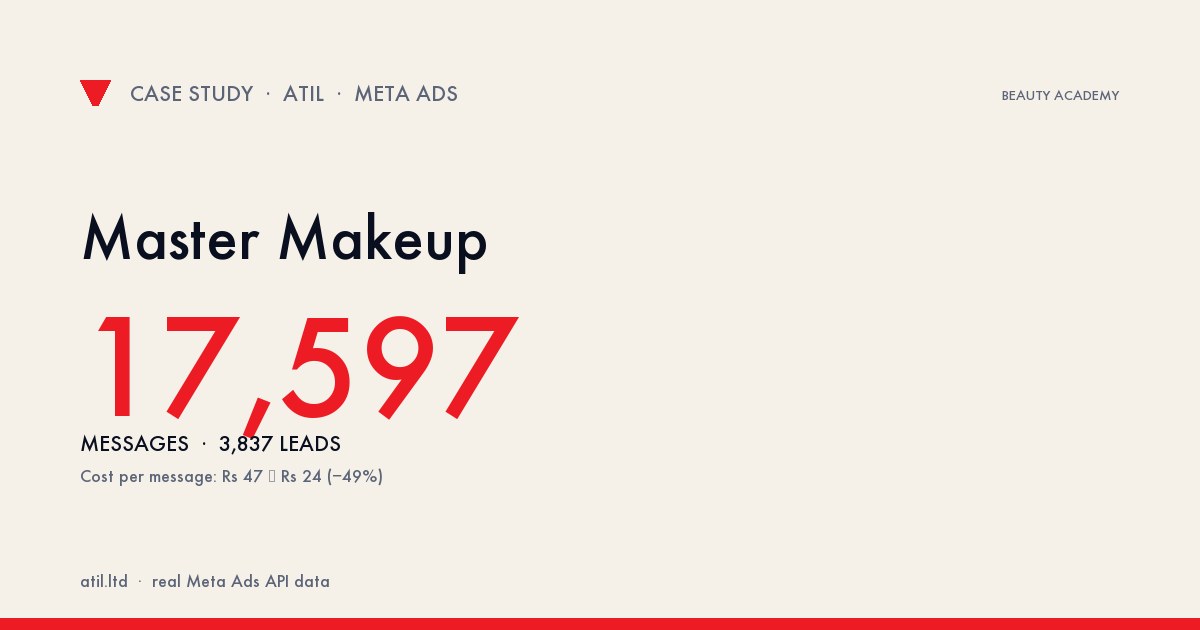
Master Makeup Academy: 17,597 WhatsApp Conversations + 3,837 Leads — Cost per Message ₹47 → ₹24 (−49%)
17,597
Messaging Conversations
₹47 → ₹24
Cost per Message
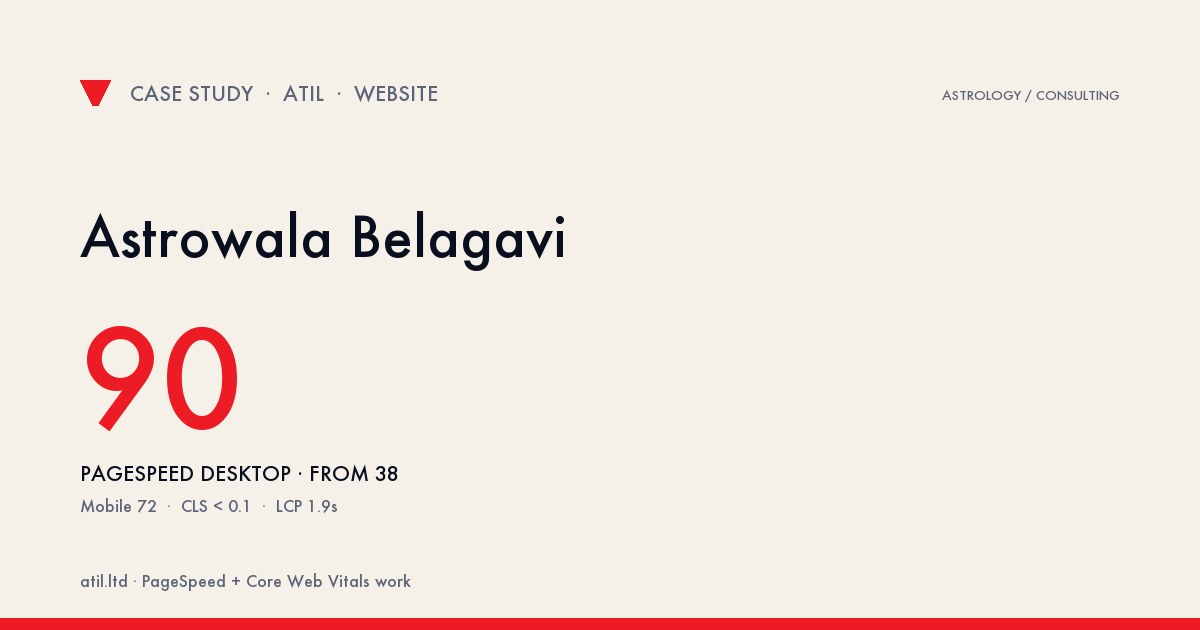
Astrowala Belagavi: Desktop PageSpeed Hits 90
90/100
Desktop PageSpeed
0.8s
Desktop LCP
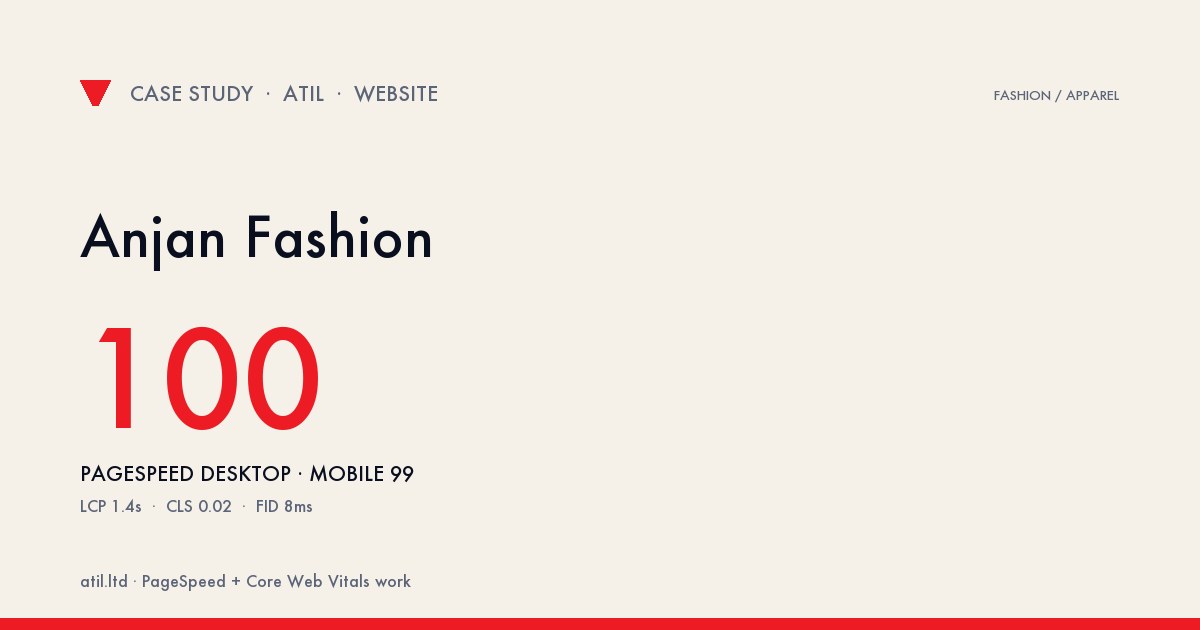
PageSpeed 100 on Desktop, 99 on Mobile for Anjan Fashion Design
100/100
Desktop PageSpeed
99/100
Mobile PageSpeed
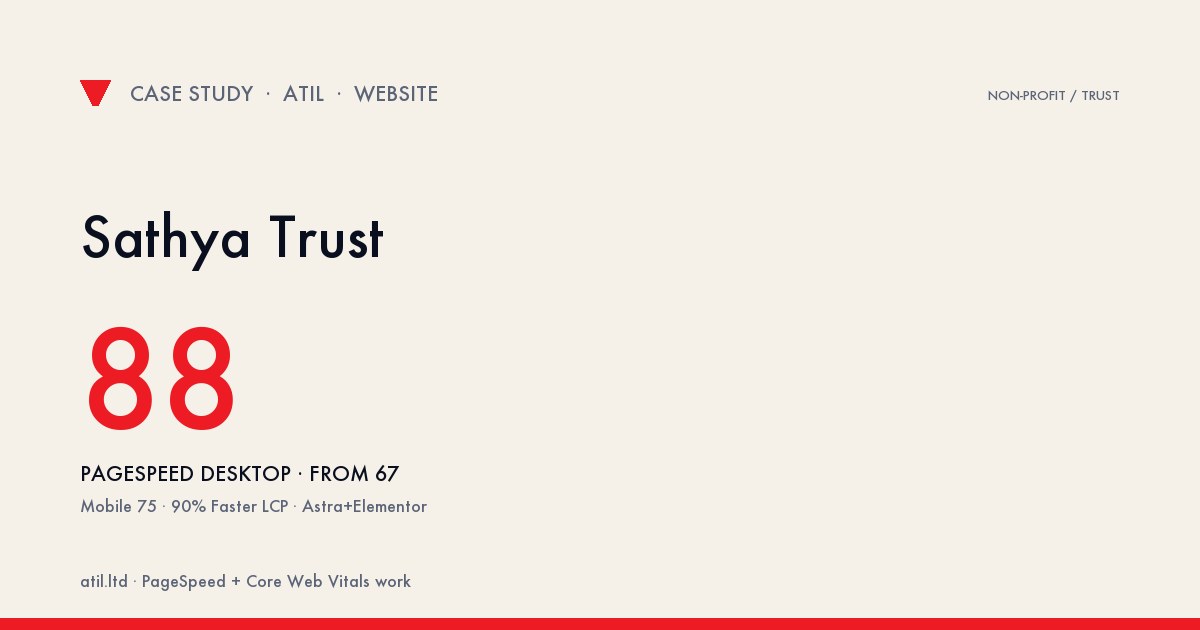
PageSpeed 67 → 88 for Sathya Trust: 90% Faster LCP
67 → 88
Desktop PageSpeed
60 → 75
Mobile PageSpeed
No stories in this category yet.
Methodology
How we report these numbers.
Source
Direct exports from Amazon Ads Console + Seller Central + Brand Analytics. No estimates, no platform aggregates.
Window
Continuous window across all 63 brands. Same accounts across the full window — no cherry-picking of best months, no selective brand exclusions.
Disclosure
Client names public only where we have written permission. Numbers cross-verified during onboarding for prospective clients on request.
Why these numbers hold up
Conservative by design, auditable by default
Most agency case studies quietly inflate their headline ROAS by summing every conversion event a platform reports — pixel, omni-channel, and in-store — so one sale gets counted three or four times. We don’t. Every number on this page is the de-duplicated value pulled straight from the client’s own 63-brand account set via the Amazon Advertising, Meta, and Google APIs. A sale is counted once.
That’s why our portfolio aggregate reads the way it does — ₹134 Cr in Amazon revenue, a 5.35x blended ROAS at a 18.7% blended ACOS, and 1M+ orders across 16 months. These are the real figures a media buyer would see logging into each account, not a marketing round-up. Where a result is a projection or an illustrative model, we label it as such.
Every engagement below is a brand we actively manage today. If a category here matches yours, we’ll screen-share the exact dashboards behind it under NDA during your free audit — so you can verify the work before you commit.
Frequently asked
Case study FAQs
Are ATIL’s case study numbers real?
Yes. Every figure comes directly from the client’s own Amazon Seller Central, Meta Ads Manager, or Google Analytics account — pulled through the platforms’ official APIs, never estimated or rounded up. The portfolio aggregate (₹134 Cr in Amazon revenue, 5.35x blended ROAS, 18.7% blended ACOS, 1M+ orders across 63 brands) is the sum of live accounts we actively manage.
How does ATIL measure Amazon advertising results?
We report the de-duplicated purchase value straight from the Amazon Advertising API and Seller Central — ad sales, ACOS, TACOS, ROAS, and the organic-vs-paid split over a defined window. We never sum overlapping conversion events (a common way agencies inflate ROAS); each sale is counted once, which is why our reported ROAS is conservative and matches the client’s own dashboard.
Can I verify these results before signing?
During onboarding we screen-share the exact dashboards behind any case study relevant to your category, under NDA. The numbers are auditable in the client’s own account — nothing here is a mock-up.
What industries has ATIL delivered results for?
We’ve driven measurable revenue across Dry Fruits, Plant-Based F&B, Fashion & Apparel, Home Décor, Tech Accessories, Phone Accessories, Industrial Hardware, B2B Components, Hardware Tools, Auto Accessories, Real Estate, Beauty Academies, Aviation Training, Astrology and Non-Profit — 63 brands in total, from D2C e-commerce to lead-gen and education.
How is this different from the ATIL clients directory?
The clients directory lists every brand and ad account we manage. These case studies go deeper on a representative set — the strategy, the before-and-after, and the exact metrics for each engagement.
Ready to be in our next case study?
Get a free Amazon Ads or website audit. We'll review your last 90 days of data and ship a 6-week improvement roadmap — no commitment required.