The Challenge
How does an agency consistently deliver Amazon advertising results across 63 brands in different categories, price points, and lifecycle stages — while ACOS targets, NTB% goals, and TACOS expectations all differ wildly?
The numbers, in plain English
ATIL runs Amazon advertising for 63 brands across India. Here’s the aggregate scorecard:
| Metric | Value |
|---|---|
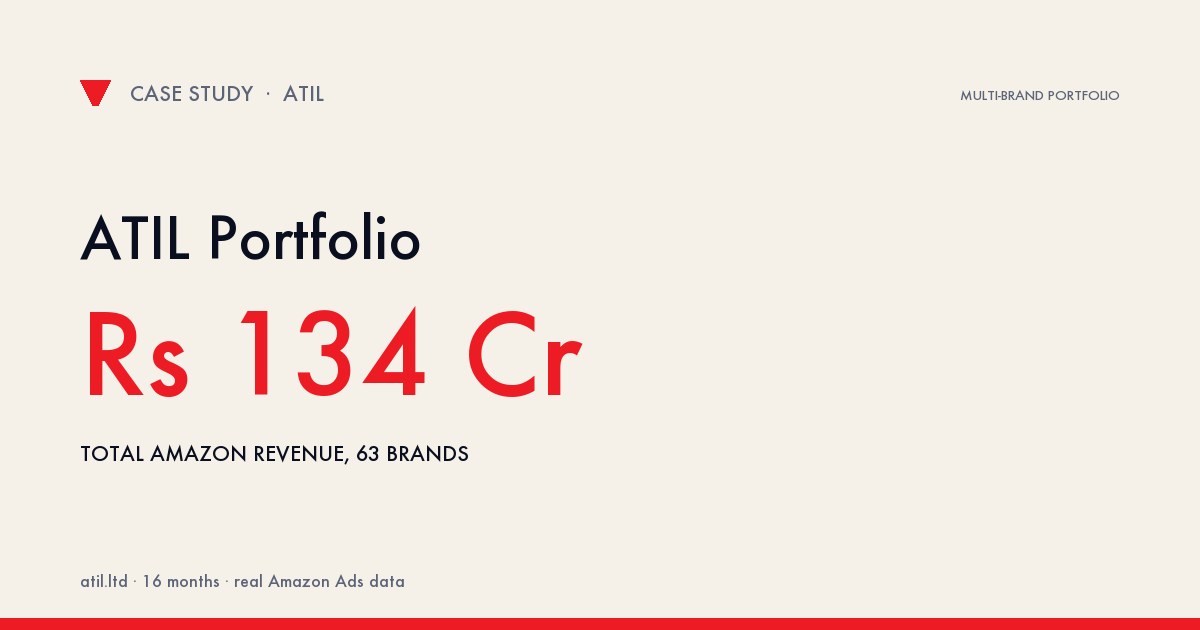
| Total Amazon Revenue (influenced by ATIL’s advertising) | ₹134.49 Cr |
| Ad-Attributed Sales | ₹55.19 Cr |
| Total Ad Spend Managed | ₹10.32 Cr |
| Blended Portfolio ACOS | 18.7% |
| Blended TACOS | 7.67% |
| Blended ROAS | 5.35x |
| Orders Shipped | 1,000,869 |
| Impressions Delivered | 2.29 Billion |
| Clicks | 15.98 M |
| New-to-Brand Orders | 143,897 (₹7.87 Cr in NTB sales) |
| Brands Managed | 63 |
For every ₹1 spent on advertising, ATIL’s brands captured ₹5.35 in ad-attributed sales — and an additional ₹7.66 in total Amazon revenue lifted by the halo effect.
Why this scale matters
Most agencies talk about “the one campaign that did 10x ROAS.” That’s not how Amazon advertising works at scale. A single home run on one client tells you nothing about whether the methodology is repeatable.
The case for ATIL’s approach isn’t one story — it’s 63 different stories, run simultaneously, across:
- Categories: dry fruits, plant-based food, automotive accessories, phone cases, industrial hardware, fashion, tools, home décor, pharmaceuticals, electronics
- Lifecycle stages: brand-new launches to category-leading incumbents
- Account types: Vendor Central, Seller Central, hybrid
- Strategic priorities: efficiency (low ACOS), NTB acquisition (high NTB%), volume (impression-heavy), halo (low TACOS)
The 18.7% blended ACOS and 5.35x ROAS hold across this entire portfolio diversity — that’s the signal.
How we hold this at scale
Three operating systems make 63-brand portfolio management possible:
1. ScaleSkus
ScaleSkus is ATIL’s in-house Amazon optimisation platform. Per-account capabilities:
- 2,800+ monthly bid + budget changes (vs ~200 manual)
- 15,000+ search terms classified per month via 3-tier pipeline (SQL → cache → LLM)
- Real-time inventory + advertising coordination (auto-pause near-stockout SKUs)
- Tri-source data fusion — Ads API + Brand Analytics + inventory feed
- Full audit trail on every automated change
2. Account-specific playbooks
Every account in our book runs on a playbook calibrated to its specific category, lifecycle stage, and strategic priority. There is no “ATIL standard ACOS target.” Targets are set per account, per quarter, with explicit ROAS / NTB / TACOS trade-offs.
3. Weekly performance reviews
Every brand gets a weekly performance review covering:
- Numbers (what changed, why)
- Decisions taken (search term classifications, bid adjustments, creative changes)
- Recommendations for the coming week
- Client check-ins where needed
The point: the agency doesn’t operate as “set bids and forget.” It operates as a continuous decisioning loop.
The top 10 brands by spend (portfolio aggregate)
| Rank | Brand | Total Spend | Ad Sales | ROAS | ACOS |
|---|---|---|---|---|---|
| 1 | Nutraj Nuts | ₹2.64 Cr | ₹14.94 Cr | 5.65x | 17.7% |
| 2 | Automaze | ₹1.36 Cr | ₹7.31 Cr | 5.38x | 18.6% |
| 3 | GoVegan | ₹0.68 Cr | ₹5.08 Cr | 7.45x | 13.4% |
| 4 | AQUA LIBRA | ₹0.51 Cr | ₹2.25 Cr | 4.41x | 22.7% |
| 5 | JstBuy Store | ₹0.38 Cr | ₹1.38 Cr | 3.63x | 27.5% |
| 6 | Fitinc Apparels | ₹0.36 Cr | ₹2.09 Cr | 5.78x | 17.3% |
| 7 | Synergy International | ₹0.33 Cr | ₹2.06 Cr | 6.21x | 16.1% |
| 8 | Synergy Etrade | ₹0.32 Cr | ₹3.09 Cr | 9.62x | 10.4% |
| 9 | GreyWings | ₹0.27 Cr | ₹1.21 Cr | 4.44x | 22.5% |
| 10 | Techhark | ₹0.25 Cr | ₹1.62 Cr | 6.40x | 15.6% |
What ATIL takes from portfolio-scale management
Five learnings that have become operating principles:
-
ACOS without TACOS is half the picture. Optimising for ACOS alone misses the halo effect — the organic Amazon revenue that ad spend unlocks. Our portfolio TACOS at 7.67% is the metric that matters for client ROI.
-
NTB% is the leading indicator of brand health. Brands with low NTB% are mining their existing audience and will plateau. Brands with high NTB% (Synergy 42.8%, Casa Metallic 36.9%, JADEMECH 31.6%) are compounding.
-
Inventory + advertising are one system. Most agencies treat them separately — and leak 10–15% of monthly spend on near-stockout SKUs. We treat them together.
-
Different categories need different playbooks. Fashion needs image-relevance focus. Industrial needs CVR-per-click over CTR. Food needs seasonal pre-pacing. There is no universal Amazon ads playbook.
-
Automation enables strategy, not the other way around. ScaleSkus removes the 80% of work that’s repetitive — bid adjustments, negative keyword harvesting, search term classification. Strategists focus on the 20% that’s actually strategic.
Want this for your brand?
Get a free Amazon advertising audit — we’ll review your last 90 days of data and ship a 6-week improvement roadmap, no commitment required.
Or browse individual case studies for category-specific deep dives.
Result
₹10.32 Cr in ad spend managed → ₹55.19 Cr ad-attributed sales + ₹134.49 Cr total Amazon revenue. Blended 18.7% ACOS, 5.35x ROAS, 1M+ orders shipped, 143,897 new-to-brand customers acquired.
₹134.49 Cr
Total Amazon Revenue
₹55.19 Cr
Ad-Attributed Sales
₹10.32 Cr
Total Ad Spend Managed
1,000,869
Orders Shipped
2.29 Billion
Impressions
63
Brands Managed